HISTORY OF EXCEL
Excel is an software application. It is Developed by Microsoft for windows, macOS, Android, iOS and ipads. Excel has many features, like features of easy calculation and computation, graphing tools, pivot tables, and a macro programming language called Visual basic for Applications (VBA).
Early history:-
- Microsoft released the first version of excel for the Macintosh on September 30,1985 and the first windows version was 2.05 on November 19,1987.

- In 1990 Excel(3.0) are introduced ,in which toolbars, drawing capabilities, outlining, add-in support, 3D charts, and many more new features are introduced

- In office 2000, there was a minor upgrade but introduced where it can hold multiple objects at once.

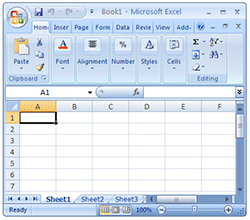
- In office 2007, there was a major upgrade as compared to previous. Office Excel 2007 introduced ribbon menu system, in which various menus are included like home, insert, page layout, Formulas, Data, Review and View, Every ribbon menu has a different functions.
- In office 2010,this is the next major version, it supports various functions:-
- Improved pivot tables.
- More conditional Formatting
- Image editing capabilities
- Also introduced to many new formulas.
- Ability to customize ribbon.

- In office 2013 , along with a lot of new tools included in this release.
- Improved Multi-threading and memory Contention.
- Power view
- Power Pivot
- Slicer
- Timeline
- 50 new Functions.

- In office 2016, along with a lot of more new tools are included in this release.
- New Chart types.
- Quick Data linking in Visio.
- Excel Forecasting Functions.
- Time grouping and Pivot chart Drill down .
- Excel data cards.
- More new function.

EXCEL SCIENTIFICALLY DEFINE:-
- Improved pivot tables.
- More conditional Formatting
- Image editing capabilities
- Also introduced to many new formulas.
- Ability to customize ribbon.
- Improved Multi-threading and memory Contention.
- Power view
- Power Pivot
- Slicer
- Timeline
- 50 new Functions.
- New Chart types.
- Quick Data linking in Visio.
- Excel Forecasting Functions.
- Time grouping and Pivot chart Drill down .
- Excel data cards.
- More new function.
EXCEL SCIENTIFICALLY DEFINE:-
Excel is an Microsoft Product, Which is an electronic spreadsheet, that contains COLUMNS,ROWS and CELL.
EXCEL USES:-
- Calculation and Computation.
- Manipulation.
- Data entry.
- Accounting.
- Easily analyze
- Performance Reporting.
- Dashboard.
EXCEL MAIN POINTS-
- Intersection of Row and Column is known as Cell.
- In electronic spreadsheet, there are total 10,48,576 columns are given in a single sheet.
- In electronic spreadsheet, there are total 16,384 rows are given in a single sheet.
- In electronic spreadsheet, there are total 255 sheets are given.
- If we talk about total number of cells in a single sheet, so we can calculate it multiply by row and column,
Comments
Post a Comment